Being proactive about monitoring your Databricks environment saves time, prevents surprises, and helps you act before small issues turn into big problems. In this guide, I’ll walk you through how to set up proactive alerts across Jobs, Pipelines, Dashboards, Operations, and Validation — all using Databricks’ built-in notification system.
Setting Up Notification Destinations
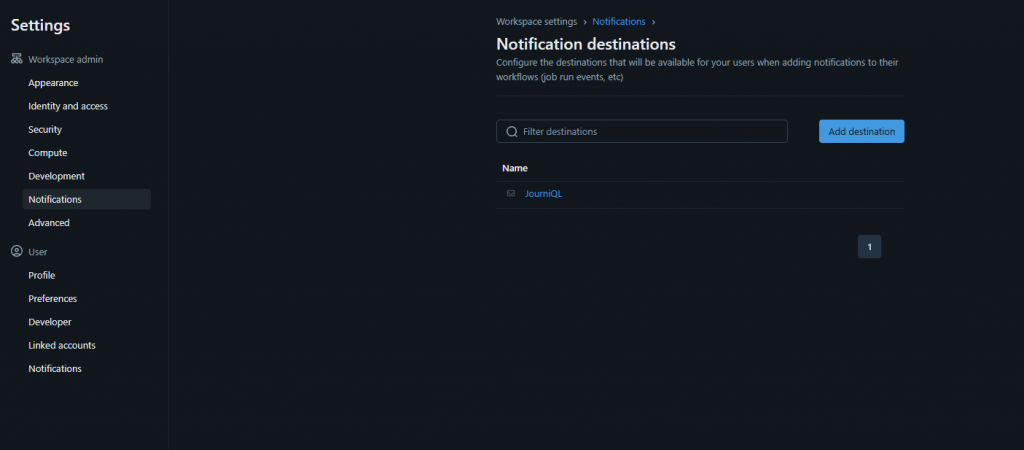
Before we jump into specific use cases, we first need to set up a notification destination.
Click on your user icon in the top right of Databricks.
Go to Settings → Notifications.
Here, you can manage destinations.
Add a new destination — for this example, I’ll use email (you can also integrate with Teams via Workflows or Power Automate).
Once your destination is added, you’re ready to start attaching alerts to different parts of Databricks.
1. Jobs
Jobs are one of the best places to start with proactive alerts because they often run on schedules and power key workflows.
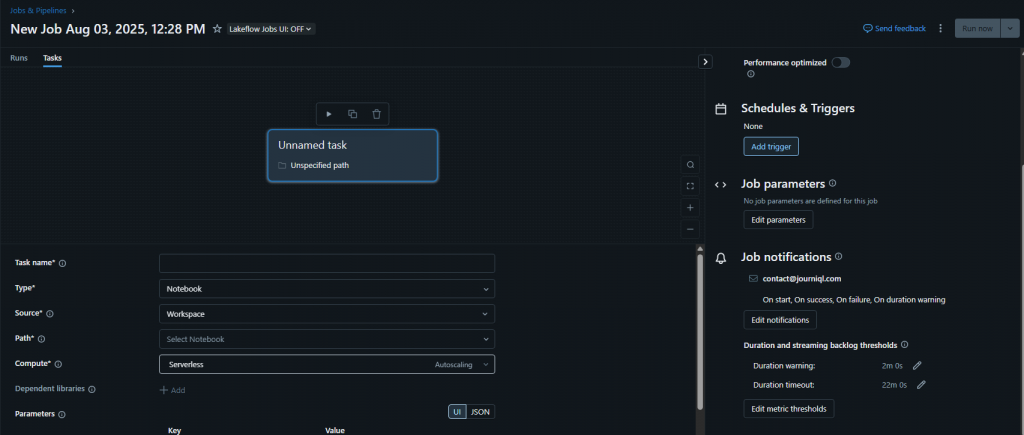
Go to your job and scroll to Job Notifications in the settings.
Click Add Notification → choose your destination (e.g., your email address).
You can configure alerts for:
Job started
Job succeeded
Job failed
Duration warnings
Streaming backlog thresholds
Pro Tip: If your job usually runs in 2 minutes, set a warning for 3 minutes and a timeout alert at 10 minutes. This gives you early warning if something is slowing down.
2. Pipelines
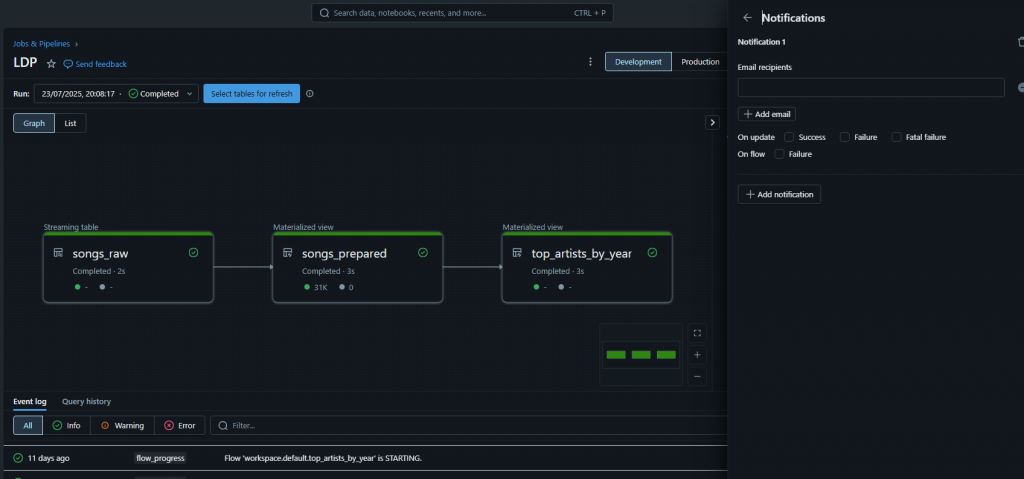
Pipelines can also trigger alerts on success, failure, or errors.
Open your pipeline → Settings → Notifications.
Add your destination and choose which events should trigger the alert.
This is especially useful for data ingestion or transformation pipelines where failures could cause downstream reporting delays.
3. Dashboards
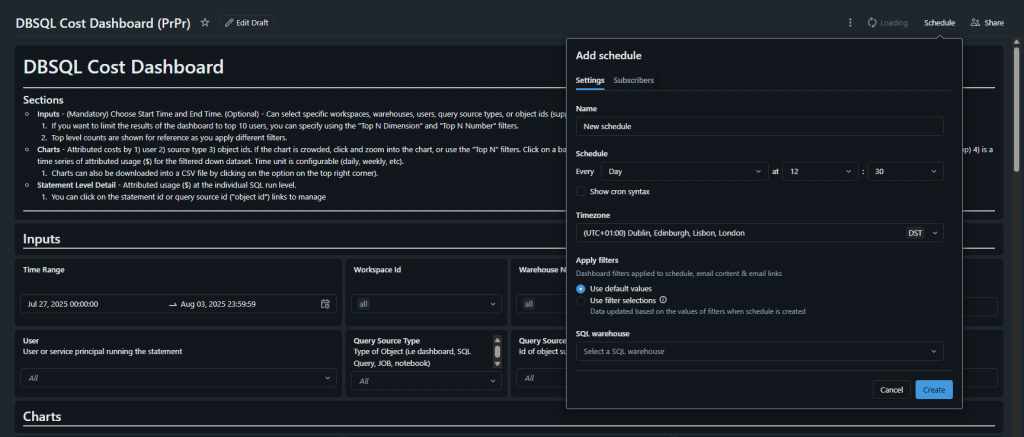
Dashboards in Databricks can be scheduled to send out automatically — a great way to proactively share updates without anyone needing to manually open the dashboard.
Publish your dashboard.
Schedule it to send daily, weekly, or at custom intervals.
Select your SQL warehouse and destination.
The result: the full dashboard is emailed to you (and your team) on schedule, so you’re always up to date without having to log in.
4. Operations
Operational monitoring is essential for keeping your Databricks clusters healthy and costs under control.
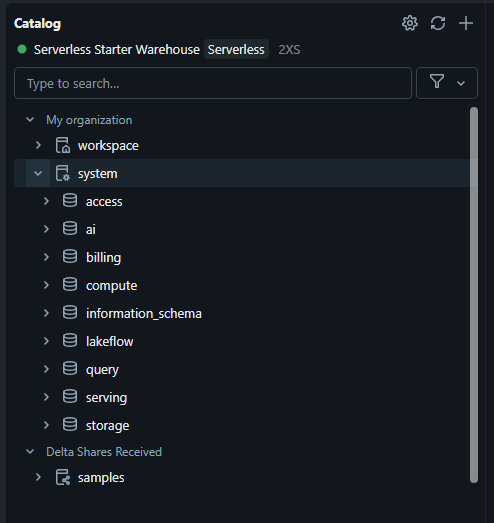
You can use system tables to monitor metrics like:
Cluster memory usage
CPU utilization
Cost tracking
From these tables, create alerts that notify you if usage exceeds thresholds or costs spike.
Note: System table data isn’t always real-time, so for immediate monitoring you might consider SQL warehouse monitoring, Azure Log Monitor, or tools like Datadog.
5. Validation
Validation alerts help ensure your data is correct before it flows into downstream systems.
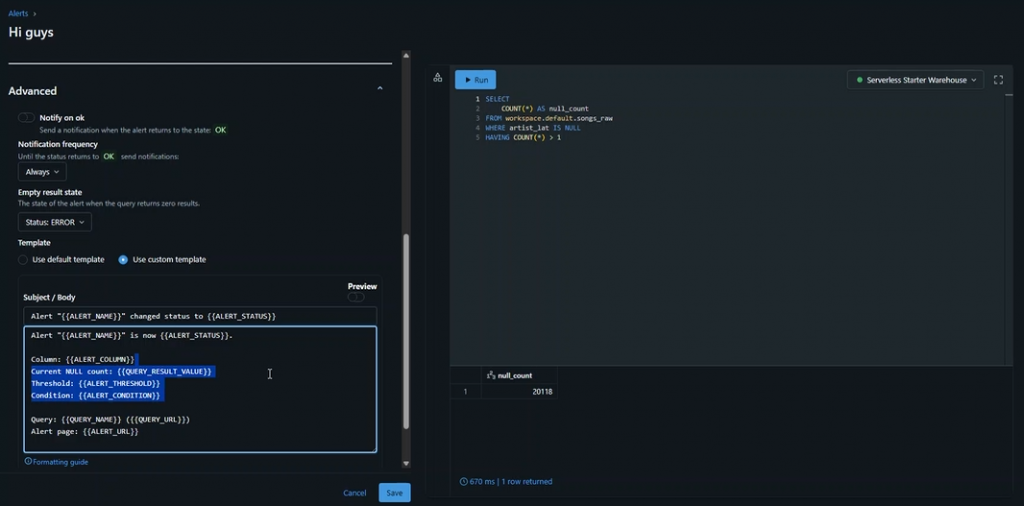
Example: Check for NULL values in a critical column.
Create a query in SQL to count nulls in your table.
Create a new alert in Databricks.
Set the condition (e.g., null count > 1).
Choose the frequency (daily at midnight, or more often if required).
Add your notification destination.
You can also use custom templates (including HTML) for your alert messages, making them more readable and tailored to your audience.
Final Thoughts
Proactive alerts in Databricks turn manual “morning checks” into automated processes, freeing you up to focus on actual problem-solving rather than detection.
Use Jobs and Pipelines alerts to catch workflow issues.
Schedule Dashboard emails for instant visibility.
Monitor Operations for resource and cost control.
Implement Validation alerts to safeguard data quality.
Set them up, tune them to what really matters, and avoid alert fatigue by only monitoring what’s important.